turning meaningful data into beauty | the new statistic application on the internet
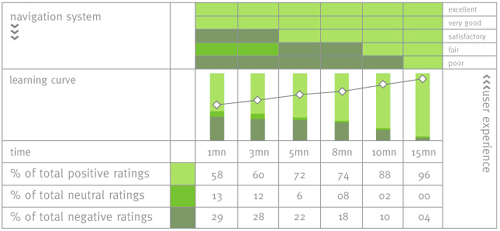
This picture is one of the data that e|behavior generated automatically matching the users experience with an online survey. ebehavior is setupin two different system: a report application as well as a survey application. By doing that I am able to match users surveys with the raw data. This system allowed me to see for instance that the first five minutes the users were missunderstood the navigation system, but after only two minutes they were totally familiar with it. This information allowed me to transform the postive ratings from %58 to %74 in less than two minutes. Wihtout ebehavior technology I would have end up with a %58 positive ratings for the navigation system even if the positive ratings were climbing to %74 after 8 minutes!
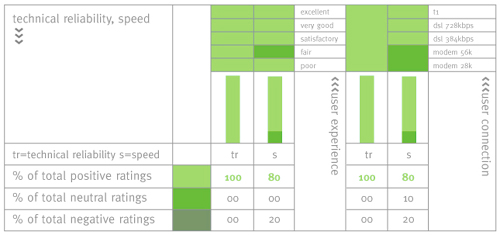
This sample delivers information speed reliability. A traditionnal statistic application will end up with the following result:
Positive ratings: %80 | Negative ratings: %20
This result will not mirror the reality. Because if we take a closer look, on the upper table we can see the user experience. And we discover that the %20 negative ratings are from unsofosticated users. In our case (jlvdesign.com) this site is designed for designers, web developers or technical person (excellent or very good user level). Which means that we end up now with a %100 positive ratings for our community.
![]()

| Architecture details | |||||||||||||||||||||||||||
|
|||||||||||||||||||||||||||
| As you can see, e|behavior provides a rich set of flexible and simple-to-use personalization features. ebehavior transformed the raw visitor data into meaningful, customizable, and easy to understand reports. Multiple end users can directly access and run these reports via their browsers. If you need more info about this product please contact me at jlv@jlvdesign.com |
|||||||||||||||||||||||||||